


In the world of agricultural commodity processing, understanding the relative value of product streams is crucial to getting the most out of your production assets. Translating current and forecast market dynamics into your production outputs is the most important thing any firm can do to add value to their raw inputs.
However, many firms are faced with constrained demand, and consequently are forced to allocate resources in a sub-optimal way. That is, while firms may have the capacity to make more of a particularly profitable commodity stream, they actively choose instead to make a product stream with lower returns due to their perceived reduced risk in holding the inventory. This can be for a number of reasons – for example, the favorable pricing may be in a market segment in which the firm has no established presence.
More often it is a case of a perceived lack of accessible demand at all pricing points, and thus firms act conservatively and choose to make the commodities they feel comfortable holding. In dairy specifically, when the spread between product streams is tight, say within USD $100/MT of milk solids input, this rationale makes sense. After all, production schedules are often fixed for the current week or two, so swapping in and out of products for marginal gains in the spot market becomes logistically difficult. Couple this with the increased risk in holding a product that you don’t have a natural home for and the desire to play it safe makes sense.
At a certain point this stops making sense. It is not beyond the realm of possibility for one product stream to outperform another by more than USD $1,000/MT of milk solids input. In fact, this has happened on a number of occasions. Chart 1 plots Historic GDT WMP, Butter, and SMP prices in $/MT.
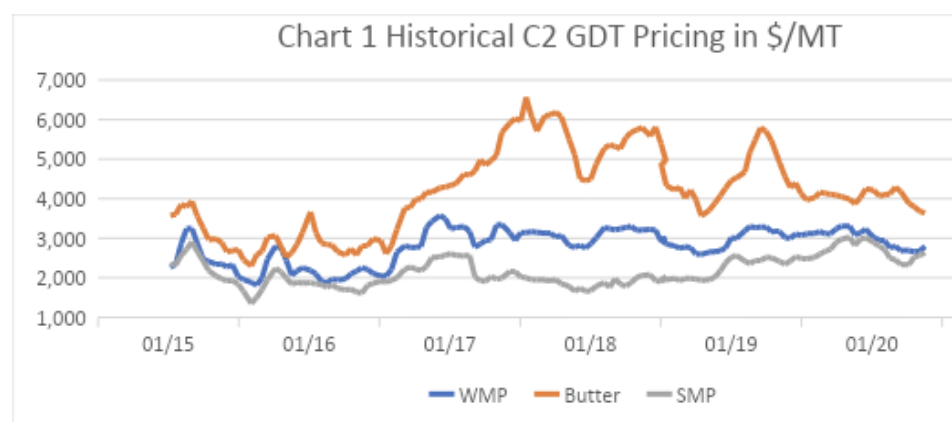
Taking our production yields and marginal costs from the stream return example in my earlier white paper Dairy Optimization 101, we can build a series of stream returns for these historical GDT prices (remember the yields and costs used are illustrative only).
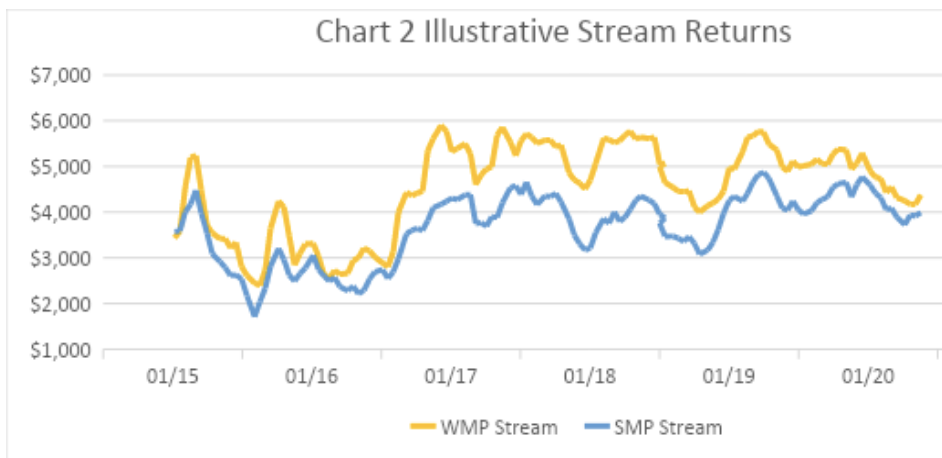
Chart 2 shows these illustrative stream returns, and we can see that for most of 2017 and 2018 the WMP stream was at a significant premium to the SMP stream. We can examine this premium further by charting the difference between the product streams, and then scaling this difference by the WMP yield – this then tells us the price premium the stream achieves per MT of WMP produced. This is shown in Chart 3.
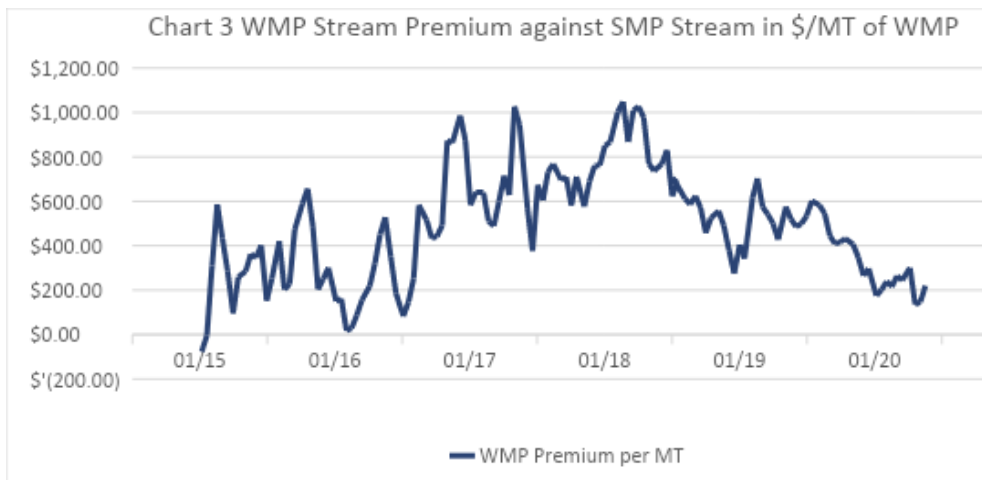
This chart shows the premium (or discount) of the WMP stream versus the SMP stream, as measured in the price of WMP per MT. What this tells us, for example, is that in April 2018, you could discount your WMP by over $800/MT and still outperform the SMP product stream.
Understanding the relative returns of product streams and the price points at which they breakeven with one another allows firms to make better production decisions. In our illustrative example above the firm may not have any additional WMP demand at the current price level, but knowing that they can discount by up to $800/MT and still capture an incremental return above the SMP alternative would surely prompt a healthy discussion in any sales meeting.
The point of course is not to dispatch production assets based on the lowest acceptable price, but rather to have visibility of the point at which streams breakeven with one another. This visibility allows for more informed decisions about which demand you choose to fulfill, and ultimately leads to a better return on your milk solids (or other) input.
Having a tool that provides visibility of the relative stream performance and allows for scenario analysis is crucial in today’s market. Being able to run a proposed contract through the optimization engine to know if it is worth confirming prior to signing the deal is an advantage few have, and possibly the most important thing a firm can do.
If you are interested in learning more about how to optimize your production please reach out to me.